Survey analytics
View response data, completion rates, and per-question breakdowns for your surveys.
Overview
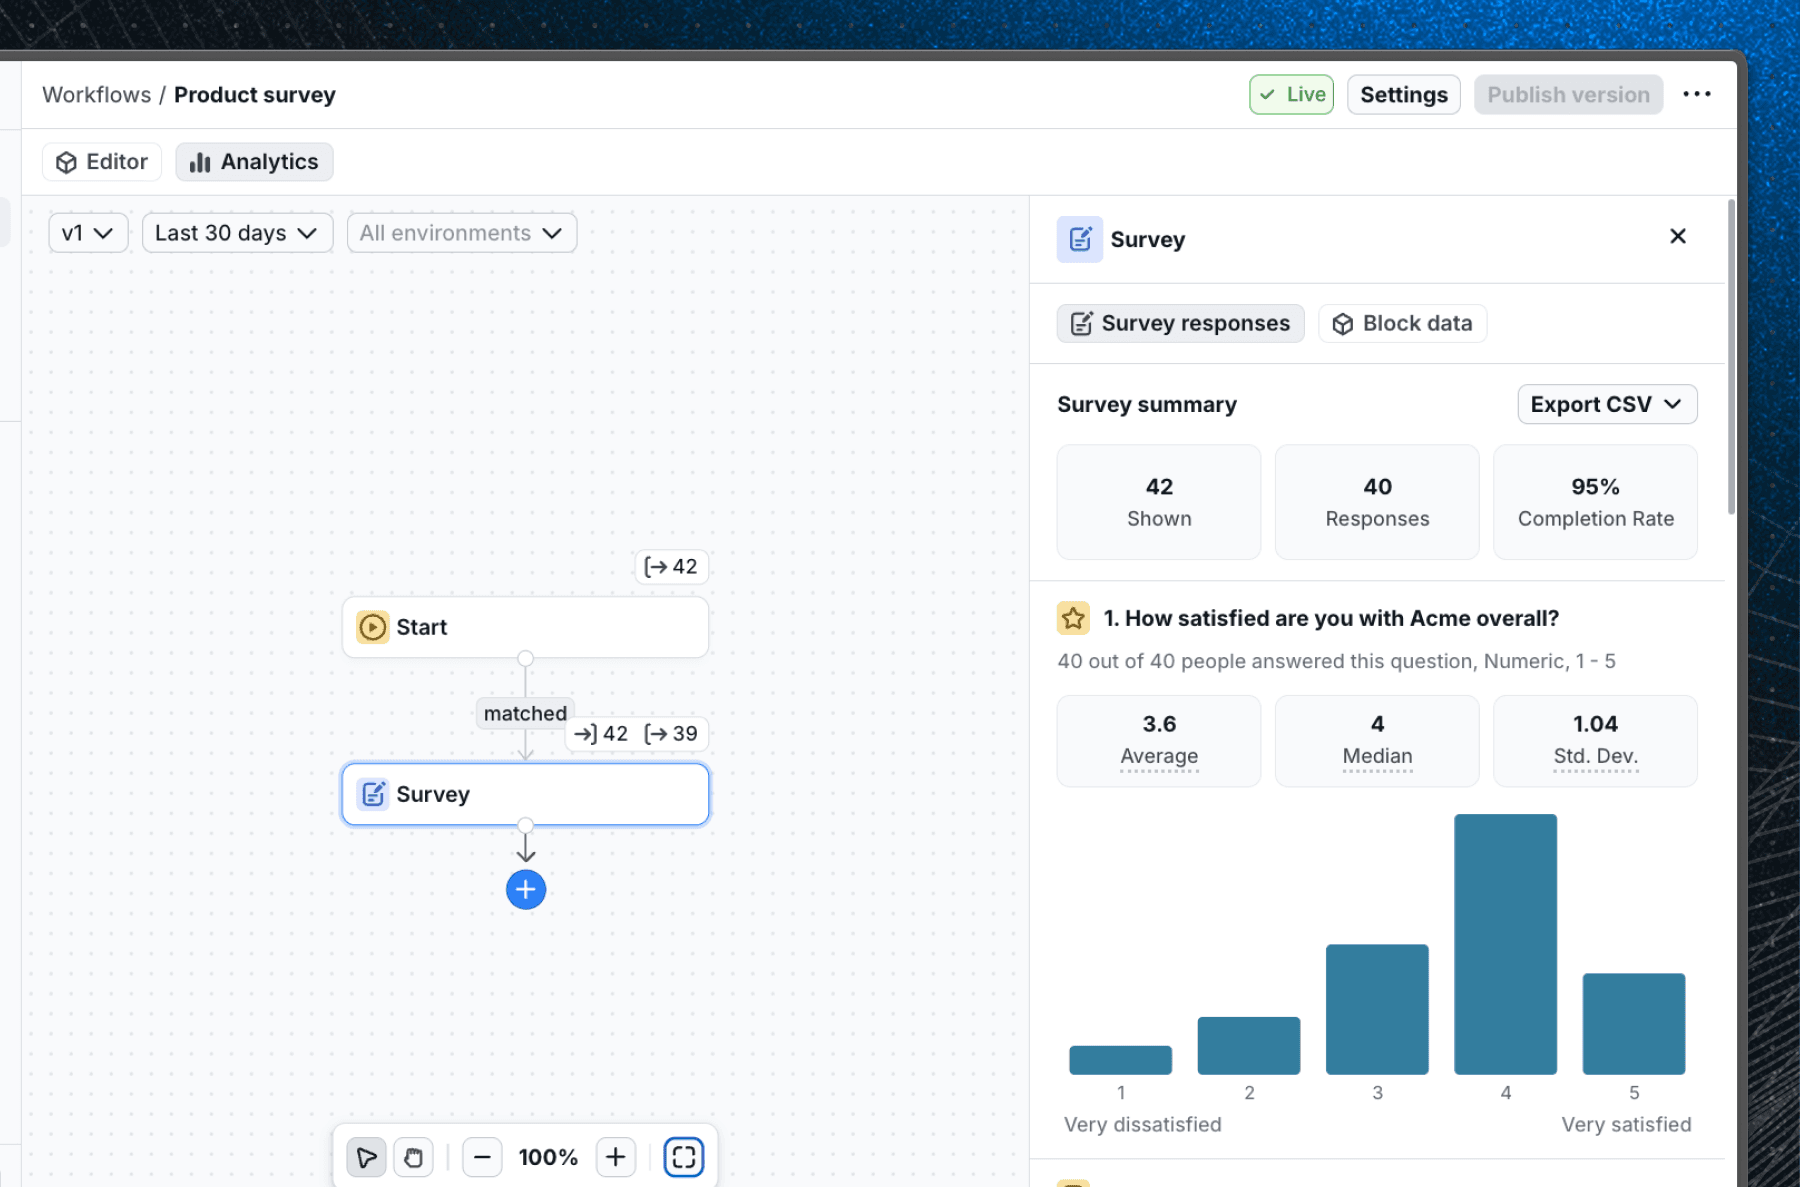
Every survey block includes a built-in analytics view. Once users start responding, you can track how many people saw the survey, how many completed it, and how they answered each question.
To open analytics, select the survey block in your workflow and click the Analytics tab.
Summary metrics
The top of the analytics view shows three summary metrics:
- Shown - the number of times the survey was displayed to users.
- Responses - the number of users who submitted the survey.
- Completion - the percentage of users who completed the survey out of those who saw it.
Per-question breakdown
Below the summary, each question has its own breakdown depending on its type.
Freeform
Displays a count of how many users submitted a response. To see the individual responses, view the CSV export.

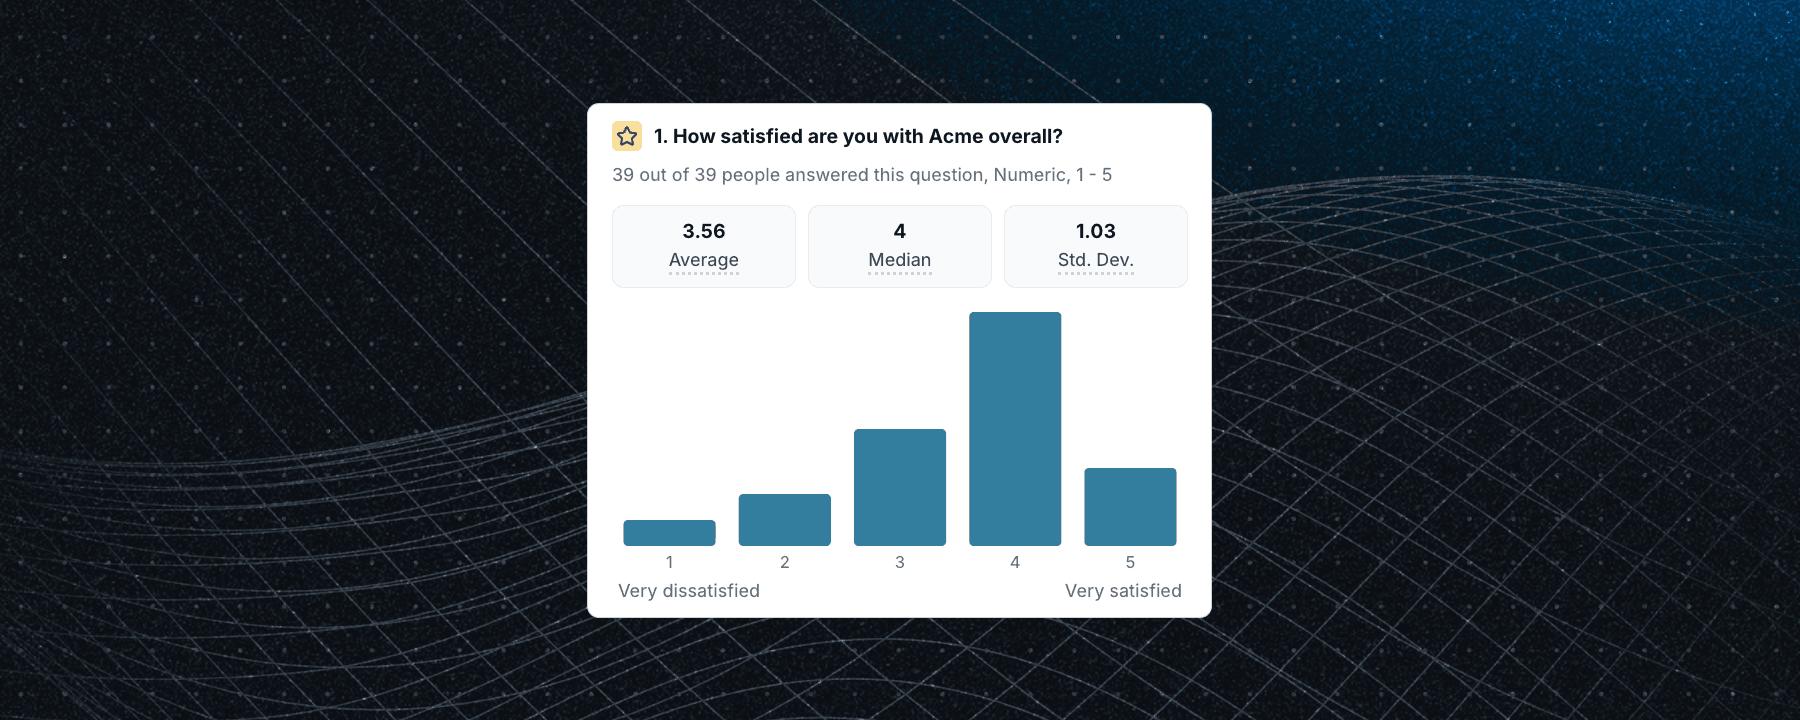
Rating
Displays a distribution chart showing how many users selected each value on the scale. Summary stats include the average, median, and standard deviation across all responses.
Single choice
Displays a bar chart showing how many users selected each option, including "Other" if enabled. Individual "Other" responses can be viewed in the CSV export.

Multiple choice
Displays a bar chart showing how many users selected each option. Users may appear in more than one bar since multiple selections are allowed. Individual "Other" responses can be viewed in the CSV export.

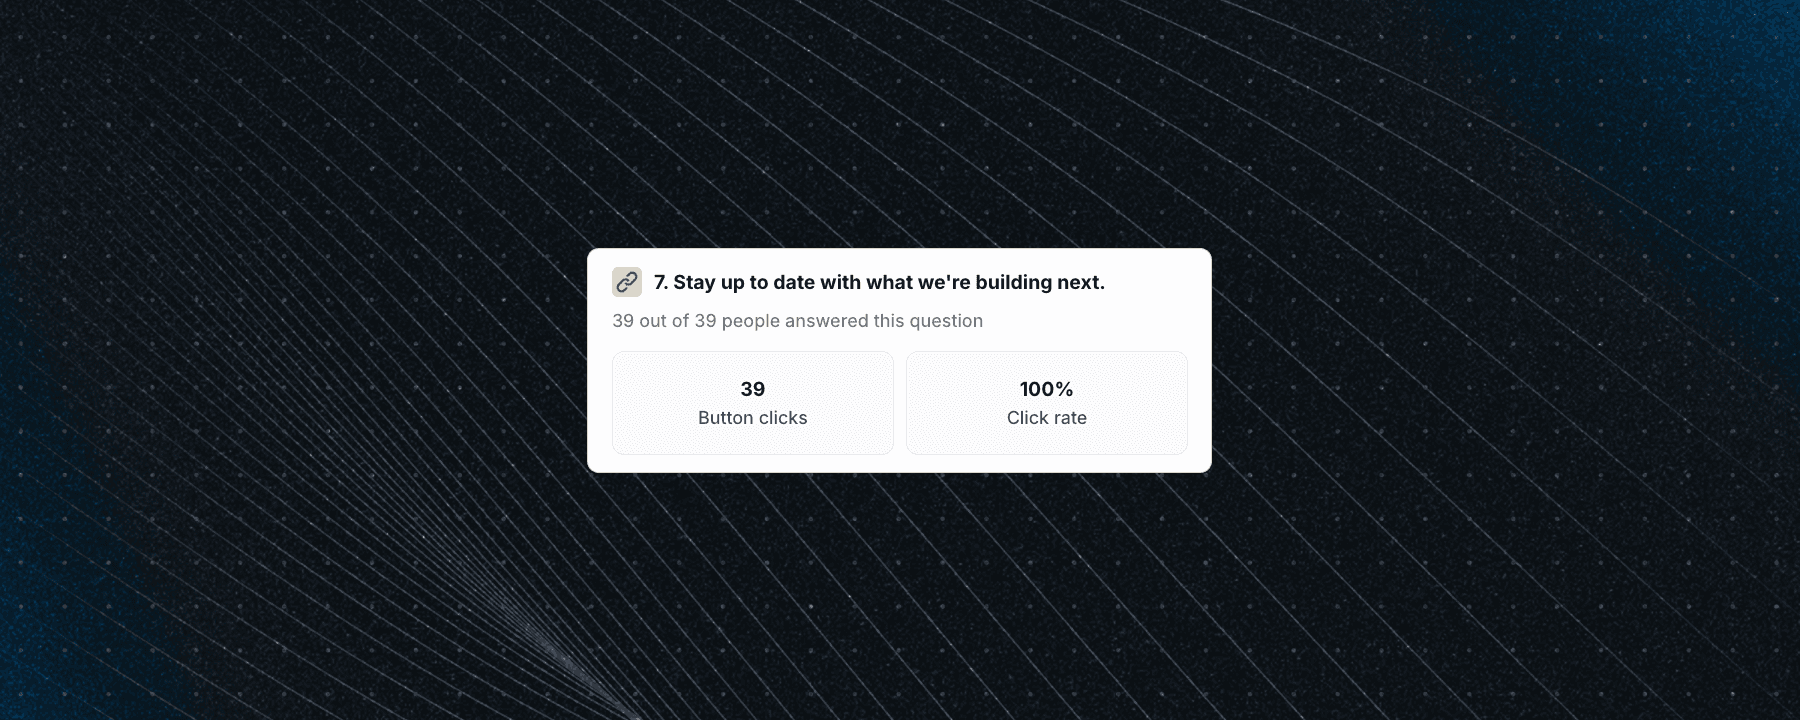
Link
Displays the number of times the button was clicked. If a URL is configured, this indicates how many users followed the link. If no URL is configured, this indicates how many users acknowledged the message. The conversion rate (button clicks divided by surveys shown) is displayed as a summary stat.
Filtering
You can filter analytics by date range and environment using the controls at the top of the analytics view. This is useful for comparing responses across different time periods or between your staging and production environments.
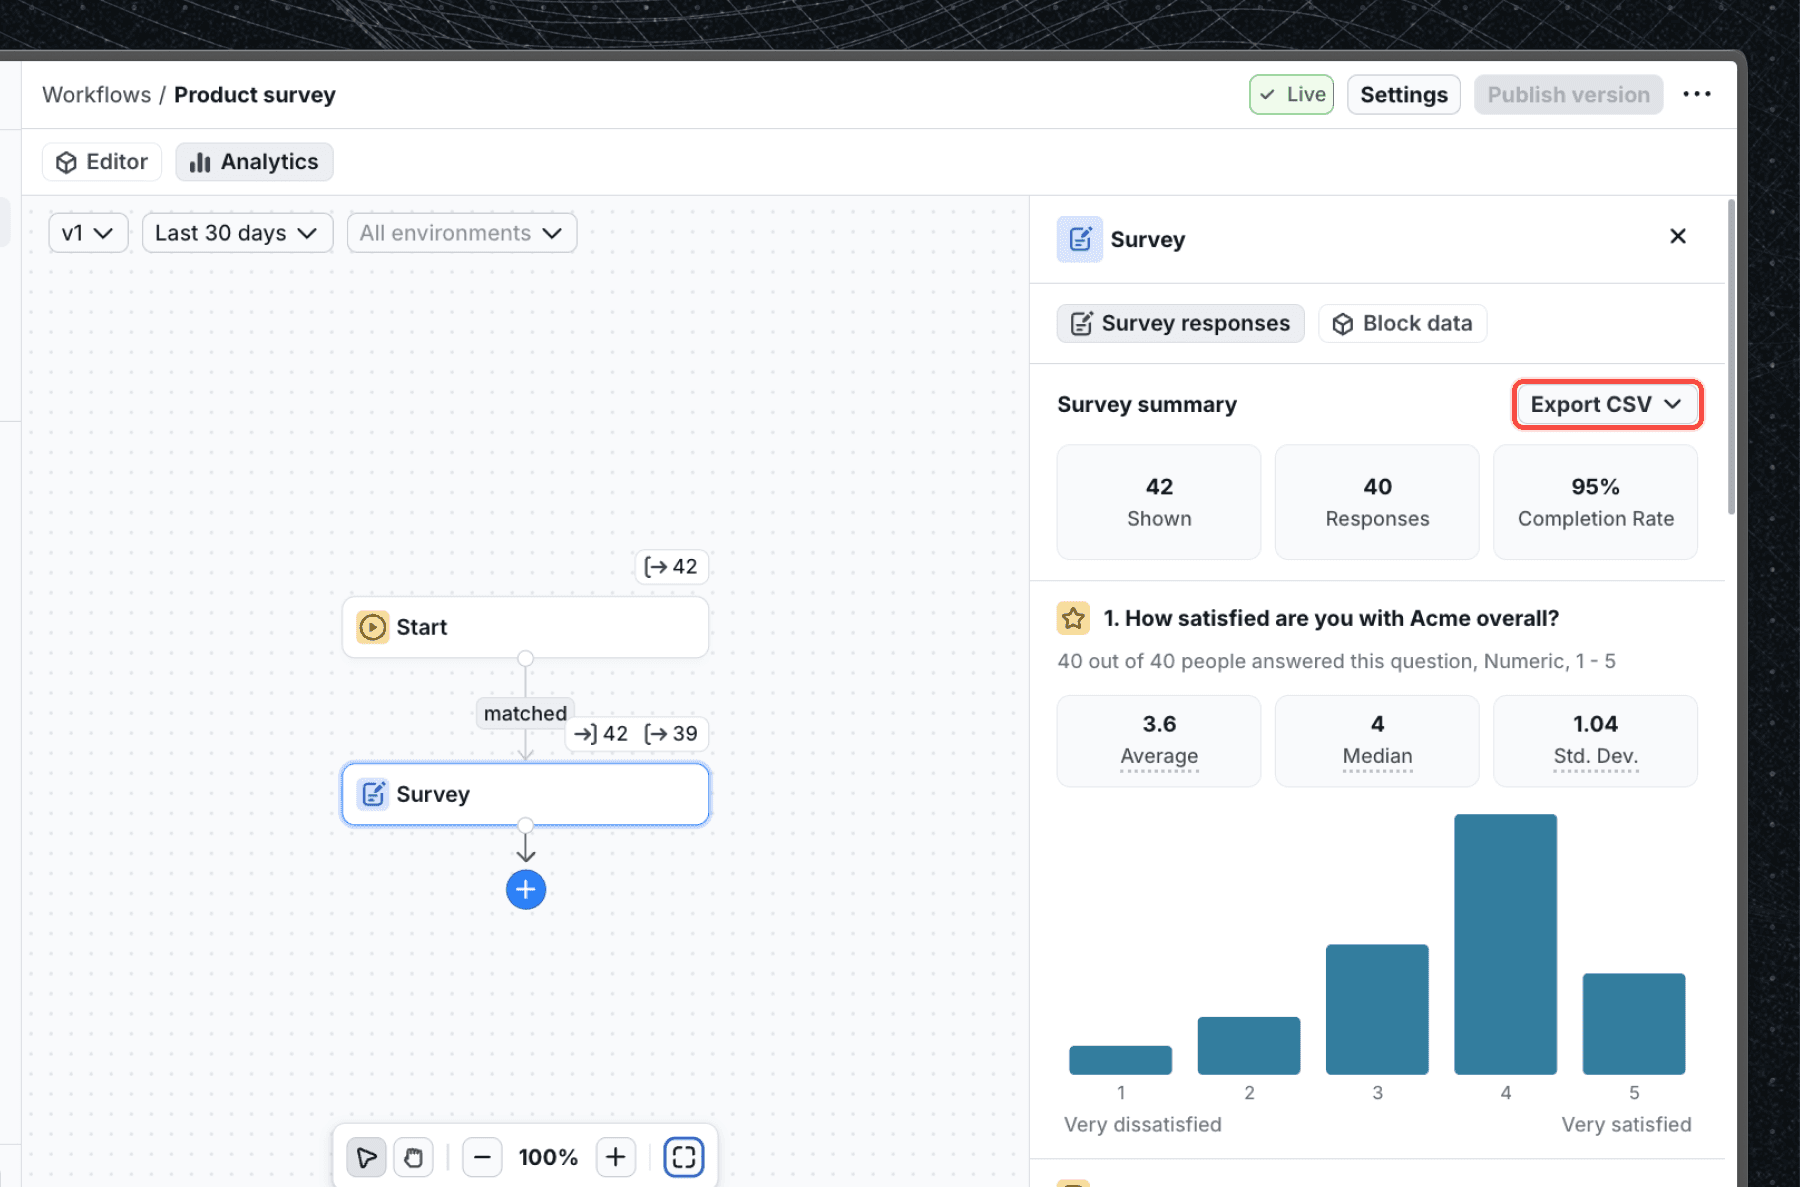
CSV export
To export all raw response data, click the Export CSV button. The CSV includes one row per response with columns for each question's answer, the submission date, and the user identifier.
Next steps
- Learn about the available question types and how to configure them.
- Follow the Create a Survey guide for a full walkthrough from setup to viewing results.
- Explore the Survey Popover example to see a fully built survey in action and access the source code.
Last updated on